Week 4
Tuesday, February 7, 2017 at 7:40:52 PM GMT+1
Four weeks in and it seems that some people are taking this seriously. Just like every year.
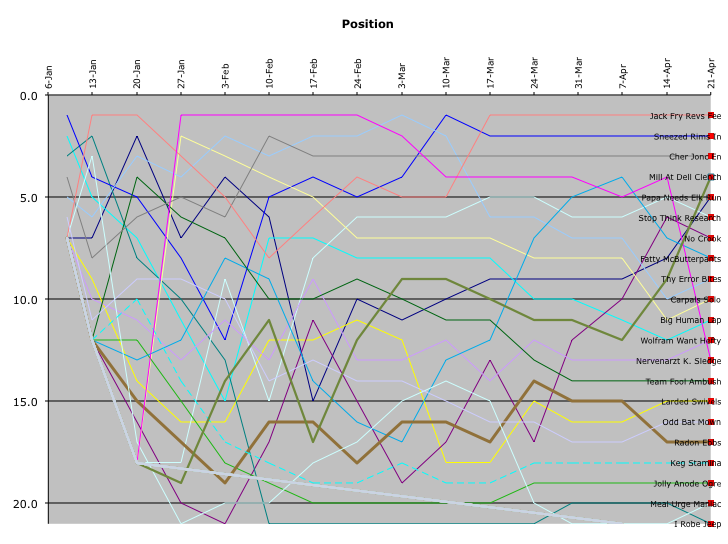
Nervenartz K. Sledge is still leading, followed by Thy Error Bites and Carpals Solo. The biggest jump in position is Stop Think Research, who climbed 9 places this week. Meanwhile, both Big Human Lap and Sneezed Rims In dropped 4 places.
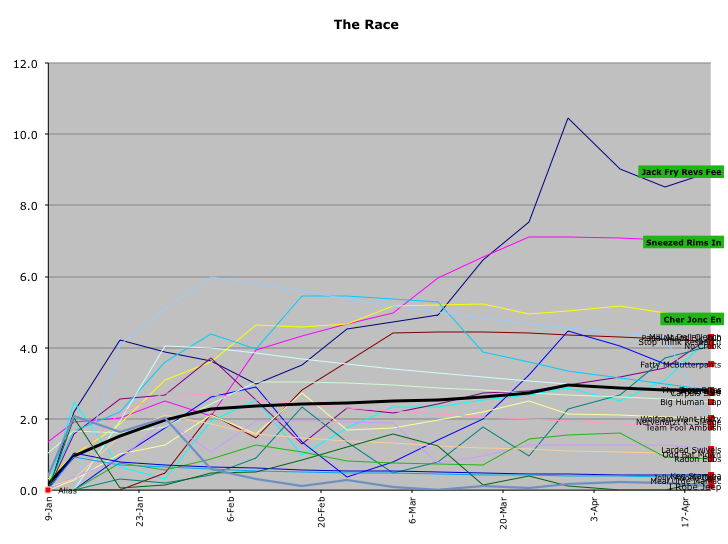
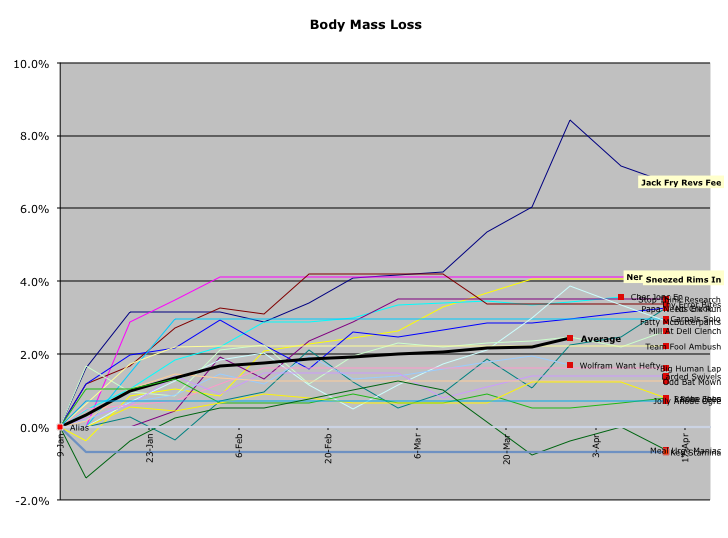
Tied for the most weight loss so far are Jack Fry Revs Free (3.2%) and Papa Needs Elk Run (2.9%) at 7.4 lb. On average, we have lost 3.471 lb so far.
Down at the bottom of our BFLG pile are Radon Ebbs, Meal Urge Maniac, and No Crook. I guess after 11 years of diet contests, they are still trying to get the hang of how to do this.
Links of the Week
In an effort to be as creepy as Google or Amazon, I’ve been collecting BFLG weight data over the years.
If you’ve been in one of our contests in the past, I have your weight data. You can see your weight over the years, and where it is trending.
My intent is not to shame you by showing your weight graphically, because many of you should already be ashamed. But here are some examples of what this data can show.
Consider the graph below. The minimum and maximum weight for this person has varied significantly over the years. This person could be an example of someone who stress eats whenever he takes a stressful job. The curves on the left give a clear indication that he probably surfs the web with his MacBook Pro on the couch while eating German chocolates when he knows he should be working out. Excel is amazing.

Note that the curves on the left graph tend to be flat, while the curve on the right tend to be linearly increasing. I can make no obvious conclusion here.

This is the work of a professional diet contestant. The curves on the left are very tight, and have a strong downward tendency. The yearly graph hovers around his average. It's as if this person likes to stay in shape, but we all know it’s all about the BFLG diet contest.
